
GHG Emissions
The greenhouse gas (GHG) emissions inventory evaluates Sheridan’s carbon footprint and progress on the GHG reduction targets to:
- Reduce overall emissions by 50% by 2020 (relative to 2010);
- Avoid emitting 500 tonnes of carbon dioxide (CO2) emissions from landfill waste by the end of 2014; and
- Eliminate 750 tonnes of CO2 emissions by the end of 2015.
Conducting a GHG inventory is the first step for an institution to start managing and mitigating its impact on climate change. The organization has more influence over direct emissions (e.g. from fossil fuels burned on-site) than it does over indirect emissions (e.g. from employee commuting).
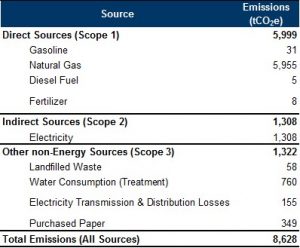
The following is a summary of Sheridan’s 2016/2017 greenhouse gas (GHG) emissions by source and Scope. It categorizes emissions as direct sources (Scope 1), indirect sources (Scope 2) and other non-energy sources (Scope 3) as per the GHG protocol – an international standard for corporate GHG inventories. The total emissions were 8,628 metric tonnes of carbon dioxide equivalent (tCO2e).
The inventory currently does not include the following sources because data are not available at this time:
- Other Purchased Products (besides purchased paper)
- Commuting
- Directly Financed Travel
- Study Abroad Travel
- Carbon Offsets & RECs
The 8,628 tCO2e is equivalent to:
- Driving 1,848 cars for a year;
- Using 3,675,090 litres of gasoline;
- Powering 22,168 Ontario homes for a year[1];
- Consuming 19,976 barrels of oil; or
- Burning 352,710 barbeque propane cylinders.
[1] Assuming an average consumption of 800 kWh/month. Ontario Ministry of Energy. Ontario Clean Energy Benefit. http://www.energy.gov.on.ca/en/clean-energy-benefit/. Accessed September 22, 2014.
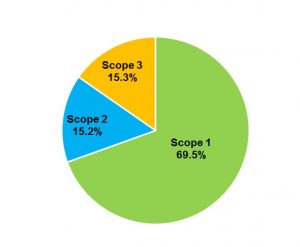
More than half of Sheridan’s 2016/2017 emissions (69.5%) were from Scope 1 sources. Scope 2 sources contributed 15.2% while Scope 3 comprised 15.3% of Sheridan’s emissions.
Not surprisingly, building energy use comprised the largest portion of Sheridan College’s total GHG emissions at 7,423 tCO2e or 87.1% of total emissions in 2016/2017. Of this, natural gas is the larger portion, contributing 69.9% while electricity makes up 15.3% (the remaining 1.8% is from electricity transmission and distribution line losses or “T&D Losses” and 0.1% from emergency generator diesel fuel use from primarily from annual testing).
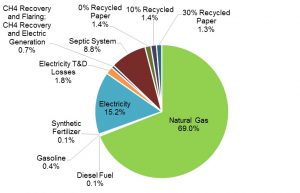
In 2016/0217, natural gas was the largest source of Sheridan College’s GHG emissions, making up over half (69.0%) of total emissions from all sources, while electricity contributed to 23.5% of the total emissions.
The following figure shows the 2016/2017 emissions broken down by source.
Besides building energy use, wastewater treatment and purchased paper were the next largest sources of Sheridan’s emissions in 2016/2017 at 8.8% and 4.0%, respectively.
Sheridan is aiming to reduce its emissions from buildings through its IECMP and Zero Waste plan.
The graph below shows the trend in emissions by Scope. Generally, emissions decreased after 2010/2011. The primary reason is Ontario de-carbonization of the electricity grid fuel mix. The emission factors for all other sources were constant through these years.
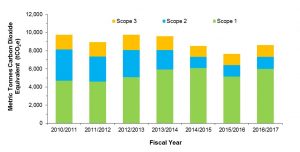
Relative to the 2010/2011 baseline, Scope 1 emissions have gone up while Scope 2 and Scope 3 emissions have decreased by almost 50%. The emissions from energy use have decreased by 13% due to IECMP efforts, despite adding new buildings to Sheridan’s campuses such as the Hazel McCallion Campus in Mississauga and a new residence at Trafalgar Campus.
[1] Assuming an average consumption of 800 kWh/month. Ontario Ministry of Energy. Ontario Clean Energy Benefit. http://www.energy.gov.on.ca/en/clean-energy-benefit/. Accessed September 22, 2014.


Follow Us!